Stream processing is a popular technique used to process large amounts of data in real-time. However, setting up and managing a stream processing system can be quite challenging. Kubernetes is an excellent platform for deploying and managing containerized applications, including stream processing systems. However, even with Kubernetes, setting up and managing a stream processing system can be time-consuming and complex.
Enter Numaflow
Numaflow is an open-source project that simplifies stream processing on Kubernetes. With Numaflow, developers can build complex data pipelines that can process streaming data in real-time, all while taking advantage of the scalability and reliability of Kubernetes.
In this blog post, we will dive into Numaflow and demonstrate how to use it to build event-driven applications such as anomaly detection, monitoring, and alerting.
Before we dive into the code, let’s first understand the key concepts in Numaflow.
Key Concepts in Numaflow
1. Pipelines
The top-level abstraction in Numaflow is the Pipeline. A Pipeline consists of a set of vertices connected by edges. A vertex can be a source, sink, or processing vertex.
2. Vertices
Vertices are the nodes in the pipeline that process data. A vertex can be a source, sink, or processing vertex.
3. Source:
A source vertex generates data and sends it to the next vertex in the pipeline.
4. Sink:
A sink vertex receives data from the previous vertex in the pipeline and writes it to an external system or performs some action.
5. Processing:
A processing vertex receives data from the previous vertex, processes it, and sends the result to the next vertex in the pipeline.
6. Edges:
Edges connect vertices in the pipeline and determine the flow of data between them.
Now that we understand the key concepts in Numaflow, let’s dive into the code.
Key Features
- Kubernetes-native: If you know Kubernetes, you already know how to use Numaflow. Numaflow is a Kubernetes-native tool for running massively parallel stream processing.
- Language agnostic: Use your favorite programming language.
- Exactly-Once semantics: No input element is duplicated or lost even as pods are rescheduled or restarted.
- Auto-scaling with back-pressure: Each vertex automatically scales from zero to whatever is needed.
How to use Numaflow?

Using Numaflow is easy. You can create a Numaflow application by defining a pipeline that consists of one or more data sources and output sinks. The pipeline can then be deployed to a Kubernetes cluster using the Numaflow CLI.
To get started, you will need to install the Numaflow CLI and create a Kubernetes cluster. Once you have done that, you can create a Numaflow application by defining a pipeline in a YAML file. Here is an example pipeline that reads data from a Kafka topic and writes it to Elasticsearch:
Installing Numaflow
Numaflow installs in a few minutes and is easier and cheaper to use for simple data processing applications than a full-featured stream processing platforms. A Kubernetes cluster is needed to try out Numaflow. A simple way to create a local cluster is using Docker Desktop.
You will also need kubectl to manage the cluster.
Installation
Run the following command lines to install Numaflow and start the Inter-Step Buffer Service that handles communication between vertices.
| kubectl create ns numaflow-systemkubectl apply -n numaflow-system -f https://raw.githubusercontent.com/numaproj/numaflow/stable/config/install.yaml
kubectl apply -f https://raw.githubusercontent.com/numaproj/numaflow/stable/examples/0-isbsvc-jetstream.yaml |
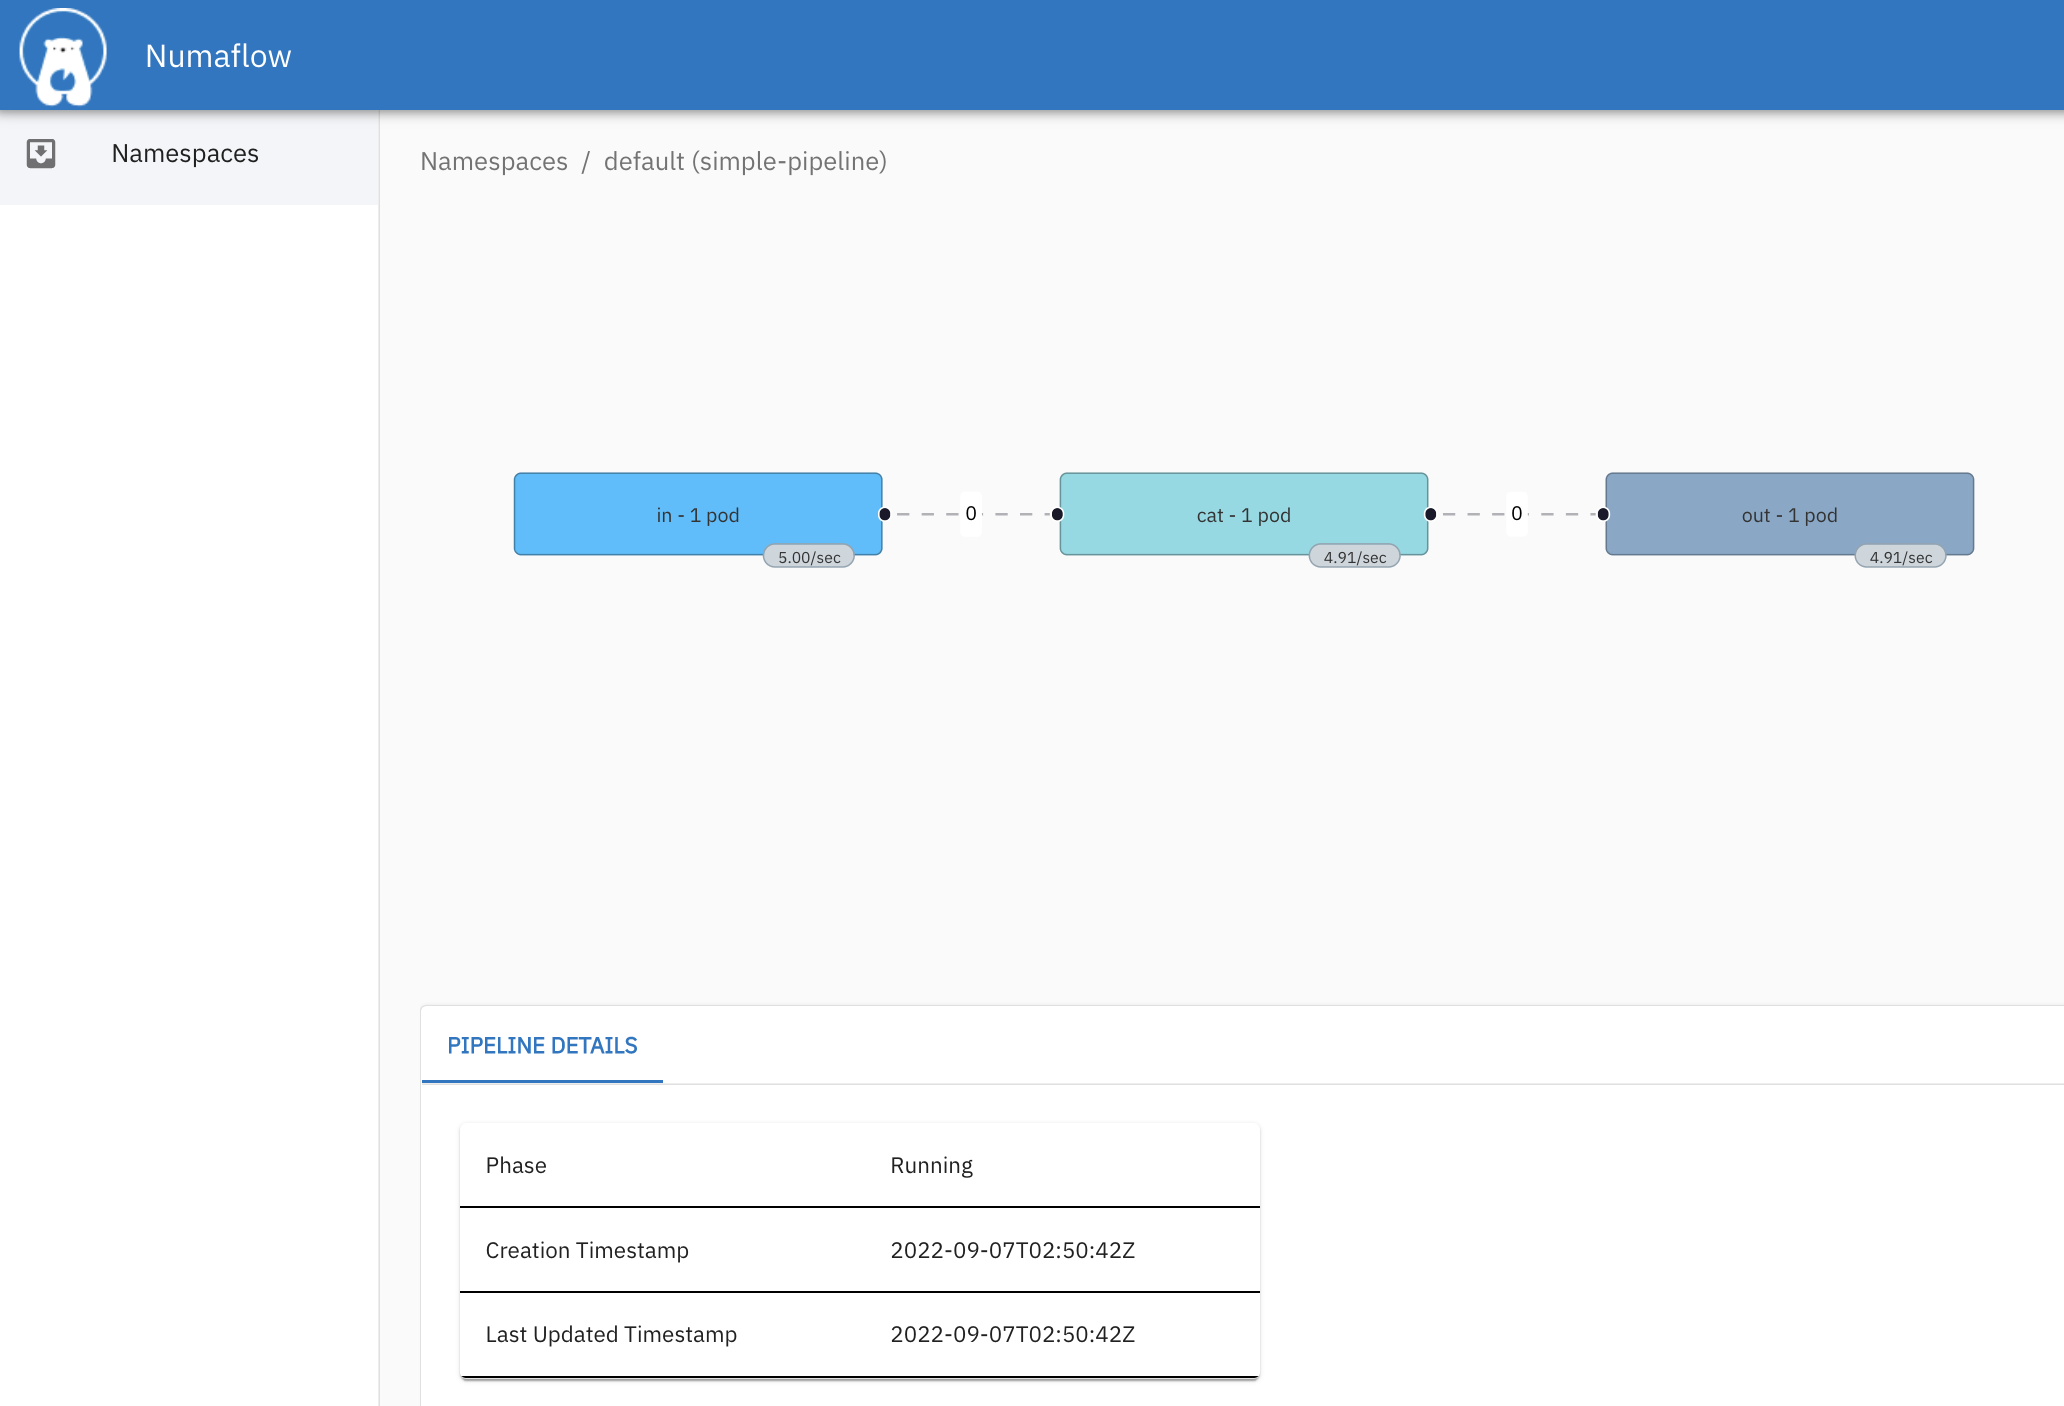
Here’s an example YAML for a simple numaflow pipeline that includes a source vertex, a processing vertex, and a sink vertex:
| apiVersion: numaflow.numaproj.io/v1alpha1kind: Pipeline
metadata: name: simple-pipeline spec: vertices: – name: source source: generator: rpu: 5 # rate of messages per unit time duration: 1s # how long to run the generator for – name: processor udf: builtin: name: cat # a built-in function to echo the messages – name: sink sink: log: {} # logs the messages edges: – from: source to: processor – from: processor to: sink |
You can save this YAML file as simple-pipeline.yaml and apply it to your numaflow cluster using the following command:
| kubectl apply -f simple-pipeline.yaml |
In this pipeline, the source vertex generates messages at a rate of 5 messages per second (rpu: 5) for 1 second (duration: 1s). The processor vertex applies the cat function, which simply echoes the messages. Finally, the sink vertex logs the messages.
You can customize this YAML by changing the generator, udf, and sink functions to suit your needs. You can also add more vertices and edges to create more complex pipelines.
Here is an example pipeline that reads data from a Kafka topic and writes it to Elasticsearch:
| apiVersion: numaflow.io/v1alpha1kind: Pipeline
metadata: name: example-pipeline spec: sources: – name: kafka-source type: kafka config: bootstrapServers: “kafka-broker:9092” topic: “example-topic” sinks: – name: elasticsearch-sink type: elasticsearch config: host: “elasticsearch:9200” index: “example-index” transforms: – name: example-transform type: custom config: className: “com.example.MyTransform” |
In this example, the pipeline consists of one source, one sink, and one transform. The source reads data from a Kafka topic named example-topic, and the sink writes it to an Elasticsearch index named example-index. The transform is a custom transform that can be implemented in Java or Scala.
Once you have defined your pipeline, you can deploy it to your Kubernetes cluster using the Numaflow CLI:
| numaflow deploy example-pipeline.yaml |
This will create a Kubernetes deployment for your pipeline, which can be scaled up or down as needed.
Here’s an example use-case of monitoring and alerting with Numaflow:
- Set up a Prometheus server
Before we can read metrics data from a Prometheus server, we need to set up a Prometheus server. This can be done using a tool like Prometheus Operator or Prometheus Helm chart. Once the Prometheus server is set up, we can use the Prometheus remote read API to read metrics data.
2. Create a pipeline
Next, we need to create a pipeline that reads metrics data from the Prometheus server, analyzes it using a custom transform, and sends alerts to a Slack channel. We can use the following pipeline YAML as a starting point:
| apiVersion: numaflow.numaproj.io/v1alpha1kind: Pipeline
metadata: name: prometheus-monitoring spec: vertices: – name: prometheus source: prometheus: query: rate(http_requests_total{status=”500″}[5m]) endpoint: http://prometheus-server:9090 frequency: 10s – name: anomaly-detection udf: image: my-anomaly-detection-transform:latest config: threshold: 0.9 – name: slack-alerts sink: slack: webhookUrl: “https://hooks.slack.com/services/XXXXX/YYYYY/ZZZZZ” channel: “#alerts” edges: – from: prometheus to: anomaly-detection – from: anomaly-detection to: slack-alerts |
In this pipeline, we have three vertices:
- In this example, the prometheus vertex reads the http_requests_total metric from a Prometheus server every 10 seconds.
- The anomaly-detection vertex applies a custom anomaly detection transform, which is specified as a Docker image in the config field. The transform applies a threshold to the incoming data and marks it as an anomaly if it exceeds the threshold.
- The slack-alerts vertex sends a message to a Slack channel when an anomaly is detected.
We connect the vertices using two edges: one from prometheus-monitoring to anomaly-detector, and one from anomaly-detector to slack-sink.
3. Implement the custom transform
Here’s an example implementation of the custom anomaly detection transform as a Python script:
| import jsonimport numpy as np
def transform(event): data = json.loads(event[“data”]) values = data[“values”] threshold = float(event[“config”][“threshold”]) for value in values: if value > threshold: value[“anomaly”] = True return event |
This transform reads incoming events in JSON format and applies a threshold to the values field. If a value exceeds the threshold, the transform marks it as an anomaly by adding a new anomaly field to the event.
- Create an output sink vertex for sending alerts to a Slack channel
To use above transform in the Numaflow pipeline, you would build a Docker image containing the transform.py script and specify it in the udf.image field of the anomaly-detection vertex. Here’s an example Dockerfile:
| FROM python:3.8COPY transform.py /transform.py
ENTRYPOINT [“python”, “/transform.py”] |
This Dockerfile copies the transform.py script to the root directory of the image and sets the entrypoint to run the script.
Finally, to send alerts to a Slack channel, you would need to create a Slack webhook URL and specify it in the slack-alerts.sink.webhookUrl field of the pipeline. Here’s how you can create a Slack webhook URL:
- Go to the Slack Apps page and create a new app.
- Navigate to the Incoming Webhooks section and click “Add New Webhook to Workspace”.
- Select the channel where you want to send alerts and click “Authorize”.
- Copy the webhook URL and paste it into the slack-alerts.sink.webhookUrl field of the pipeline.
With this pipeline, you can monitor a system for anomalies and receive alerts in a Slack channel when they occur.
Once the pipeline is deployed, you can use the kubectl command to monitor the status of the pipeline, view logs, and troubleshoot any issues that may arise.
Conclusion
In this article, we have explored how to use Numaflow to build a simple stream processing pipeline on Kubernetes. We started by discussing the basic architecture of a stream processing pipeline, and then walked through the steps of setting up a pipeline using Numaflow. We also provided an example use-case of anomaly detection to demonstrate how Numaflow can be used to build event-driven applications. Numaflow provides a powerful and flexible framework for simplifying stream processing on Kubernetes. With its support for a wide range of data sources and sinks, as well as its ability to handle real-time data processing, Numaflow is an ideal choice for building event-driven applications such as anomaly detection, monitoring, and alerting.


Leave a Reply