Introduction
Kubernetes has become the cornerstone of containerized application orchestration, but with great power comes the challenge of managing the logs it generates. These logs hold critical information for debugging, monitoring, and improving application performance. In this blog, we will demystify Kubernetes logs, explore their types,
Introduction
Kubernetes has become the cornerstone of containerized application orchestration, but with great power comes the challenge of managing the logs it generates. These logs hold critical information for debugging, monitoring, and improving application performance. In this blog, we will demystify Kubernetes logs, explore their types, collection methods, and best practices.
What are Kubernetes Logs?
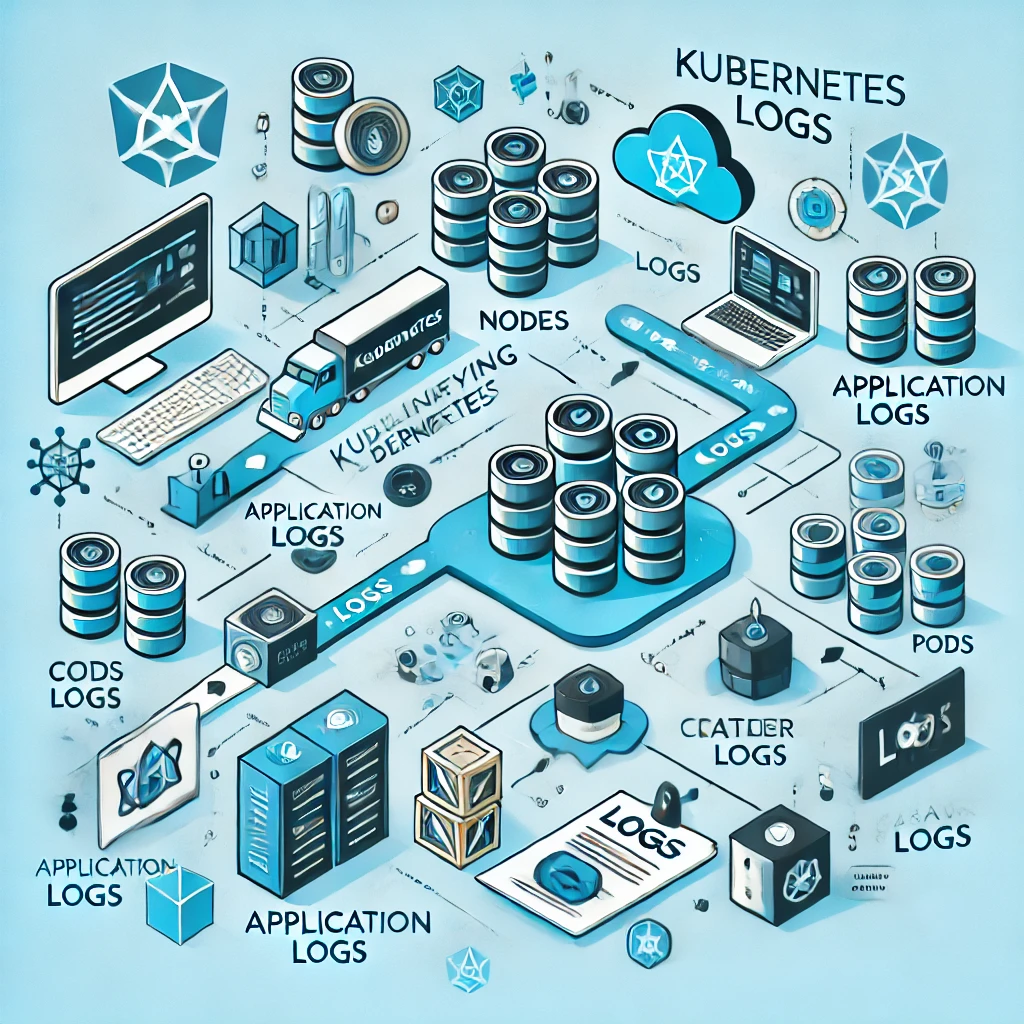
Logs in Kubernetes capture events and messages generated by various components, such as containers, Pods, nodes, and the Kubernetes control plane. They provide insights into:
- Application Behavior: Errors, warnings, and performance metrics.
- System Events: Node and Pod status updates.
- Debugging Information: Diagnosing issues at the application or system level.

Types of Kubernetes Logs
-
Application Logs:
- Generated by containers running inside Pods.
- Includes stdout and stderr streams.
- Useful for tracking app-specific issues.
-
Cluster Logs:
- Captures events at the cluster level, such as resource scheduling and state changes.
- Includes logs from components like the API server, kubelet, and scheduler.
-
Node Logs:
- Includes system-level logs for monitoring hardware and operating system events.
How Kubernetes Logs Work
Each container in Kubernetes writes logs to its local filesystem or streams them to stdout and stderr. Kubernetes captures these logs, making them available through kubectl commands:
bashCopy codekubectl logs <pod-name>
However, logs are ephemeral—they disappear when a container is terminated or a Pod is deleted. This is where log collection systems come into play.

Log Collection and Management
-
Manual Collection:
Access logs usingkubectl logs. While simple, this method isn’t scalable for large clusters. -
Centralized Log Aggregation:
Tools like Fluentd, Elasticsearch, and Loki are commonly used for aggregating logs.- Fluentd collects logs from Pods and forwards them to a storage backend.
- Elastic Stack (ELK) provides powerful querying and visualization capabilities.
-
Cloud-Based Logging Solutions:
Platforms like Google Cloud Logging and AWS CloudWatch integrate seamlessly with Kubernetes clusters.
Best Practices for Managing Kubernetes Logs
-
Standardize Logging Formats:
Use structured formats like JSON for easier parsing and analysis. -
Set Retention Policies:
Configure log storage with appropriate retention periods to balance storage costs and compliance requirements. -
Leverage Labels and Metadata:
Use Kubernetes labels (e.g., app, environment) to filter logs effectively. -
Monitor Log Volume:
Keep an eye on log sizes and set limits to avoid overwhelming your infrastructure.
Debugging with Kubernetes Logs
Logs are invaluable for diagnosing issues in your cluster. Common commands include:
- Viewing logs from all containers in a Pod:bashCopy code
kubectl logs <pod-name> --all-containers - Debugging with specific timestamps:bashCopy code
kubectl logs <pod-name> --since=1h
Conclusion
Understanding and managing Kubernetes logs is essential for maintaining robust and reliable applications. By implementing best practices and leveraging log aggregation tools, you can simplify troubleshooting, enhance observability, and ensure your Kubernetes environment runs smoothly.


Leave a Reply